Last week, I worked on 2 small projects in 11.4 Junos. I should:
- Find a way to automatically disable a physical link when LACP "flapped" too many times during a given time.
- Find a way to automatically disable a physical link when too many CRC errors are observed during a given time.
1/ LACP DAMPENING:
Currently vendors do not provide LACP dampening mechanism. We are currently writing RFE (Request For Enhancement) to implement feature.
But I couldn't wait at least one year to have a kind of dampening LACP feature on my Junos. So, I tried to implement this feature by using event-policy.
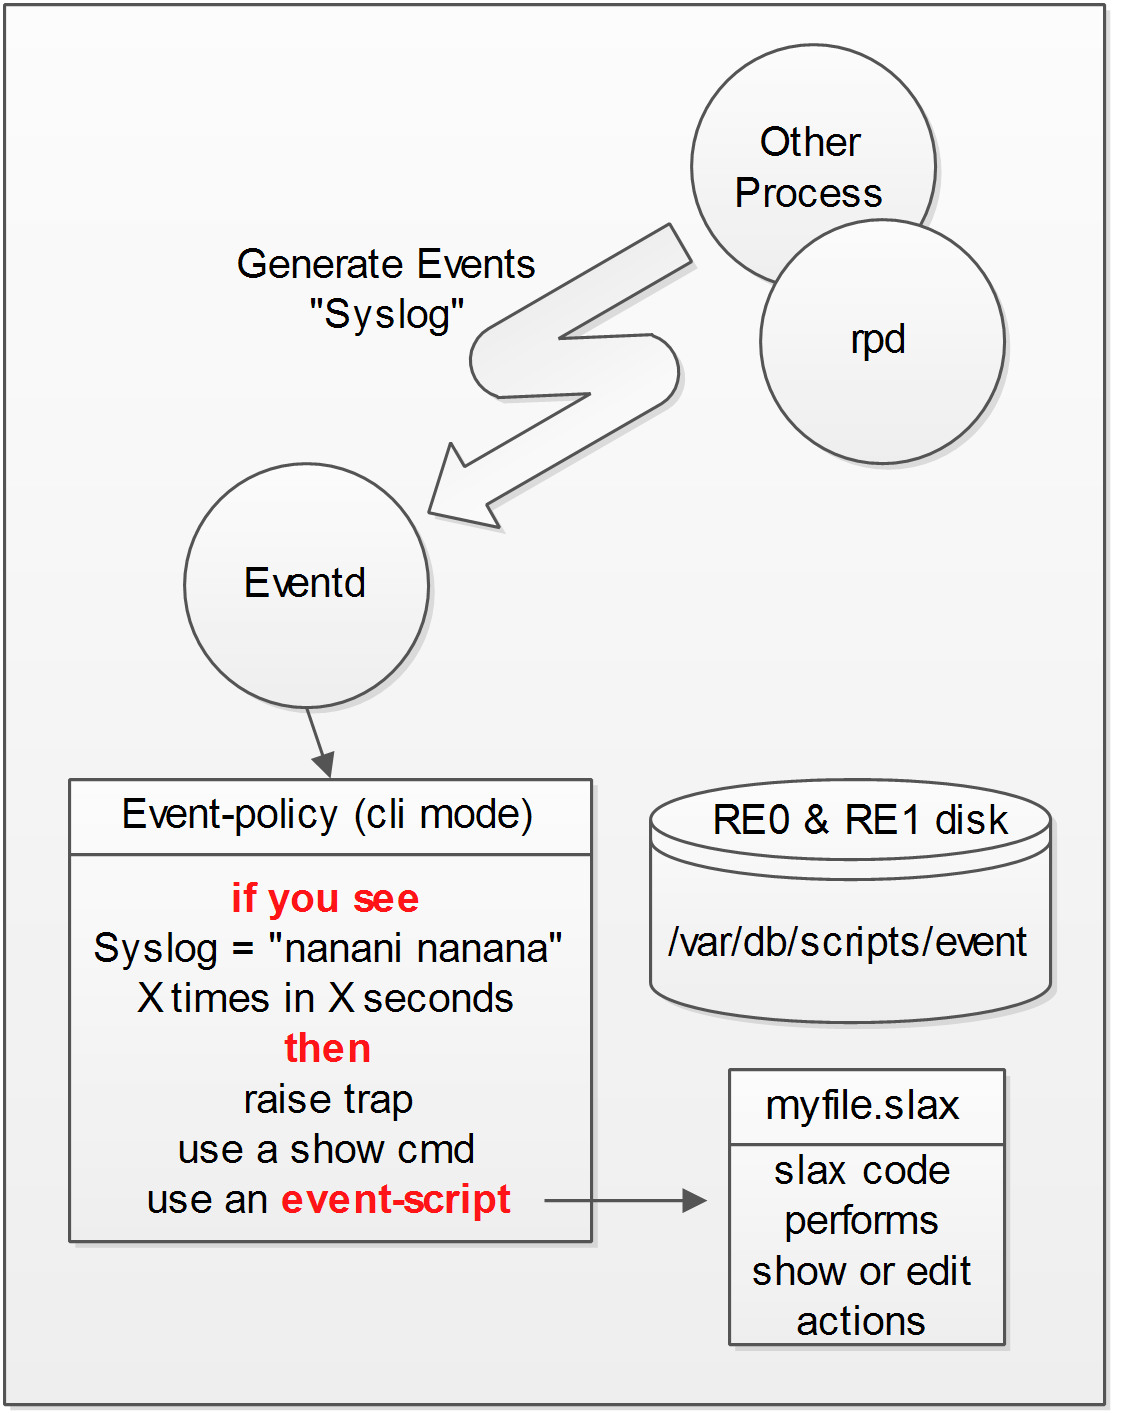
Event-policy are handled by Eventd process. Eventd can trigger actions (operational and configuration cmds) on reception of events: events are "Syslog" generated by all other processes. Eventd can also call some specific scripts named event-scripts to perform multiple actions (show cmds, commit some changes, syslog generation...). This picture shows the concept:

So, to build my feature I used this event policy:
event-options {
policy LACP-DAMP {
events KERNEL;
within 120 {
trigger after 6;
}
attributes-match {
KERNEL.message matches KERN_LACP_INTF_STATE_CHANGE;
}
then {
event-script lacp-damp.slax;
}
}
event-script {
file lacp-damp.slax;
}
}
The event policy works like that: If eventd "sees" 4 lacp down events for a given interface during less 60 seconds, it calls the script lacp-damp.slax
Note, the script lacp-damp.slax must be pushed on both RE in the folder /var/db/scripts/event before committing the above event-policy.
The lacp-damp.slax code is available here. It is detailed below:
/* -------------------------------------------------*/
/* Slax written by door7302@gmail.com Version 1.0 */
/* -------------------------------------------------*/
version 1.0;
ns junos = "http://xml.juniper.net/junos/*/junos";
ns xnm = "http://xml.juniper.net/xnm/1.1/xnm";
ns jcs = "http://xml.juniper.net/junos/commit-scripts/1.0";
import "../import/junos.xsl";
match / {
var $regex1="is 0 ";
var $regex2="DETACHED";
var $sep1 = "( )";
/* Retrieve the entire syslog */
var $message = event-script-input/trigger-event/attribute-list/attribute[name=="message"]/value;
/* Find1 is a < junos 12.3 syslog and Find2 12.3 or > syslog */
var $find1 = jcs:regex($regex1,$message);
var $find2 = jcs:regex($regex2,$message);
if ($find1 !="" || $find2 !="" )
{
var $mytab1 = jcs:split ($sep1,$message);
if ($find1 !="") {
var $iif = $mytab1[8];
/* Now create the config environment */
var $configuration-rpc = {
<get-configuration database="committed" inherit="inherit">;
<configuration> {
<interfaces>;
}
}
/* Open the connection to enter the config */
var $connection = jcs:open();
var $configuration = jcs:execute( $connection, $configuration-rpc );
/* Define what you want to change : here disable the $iif interface */
var $change = {
<configuration> {
<interfaces> {
<interface> {
<name> $iif;
<disable>;
}
}
}
}
/* commit the config and retrieve the result of the commit */
var $results := { call jcs:load-configuration( $connection, $configuration=$change ); }
/* If commit failed, generate a specific syslog in messages */
if( $results//xnm:error ) {
for-each( $results//xnm:error ) {
expr jcs:syslog(25, "NEW event-script LACP-DAMP Error, failed to commit..." );
}
}
/* if commit passed, generate a human readable syslog in messages */
else {
var $new_message = "Event-script LACP-DAMP: LACP on " _ $iif _ " flapped too many times. Disable it by config";
expr jcs:syslog(25, $new_message);
}
/* close the connection. End of the script */
expr jcs:close( $connection );
}
if ($find2 !="") {
var $iif = $mytab1[4];
/* Now create the config environment */
var $configuration-rpc = {
<get-configuration database="committed" inherit="inherit">;
<configuration> {
<interfaces>;
}
}
/* Open the connection to enter the config */
var $connection = jcs:open();
var $configuration = jcs:execute( $connection, $configuration-rpc );
/* Define what you want to change : here disable the $iif interface */
var $change = {
<configuration> {
<interfaces> {
<interface> {
<name> $iif;
<disable>;
}
}
}
}
/* commit the config and retrieve the result of the commit */
var $results := { call jcs:load-configuration( $connection, $configuration=$change ); }
/* If commit failed, generate a specific syslog in messages */
if( $results//xnm:error ) {
for-each( $results//xnm:error ) {
expr jcs:syslog(25, "NEW event-script LACP-DAMP Error, failed to commit..." );
}
}
/* if commit passed, generate a human readable syslog in messages */
else {
var $new_message = "Event-script LACP-DAMP: LACP on " _ $iif _ " member of " _ $lag _ " flapped too many times. Disable it by config";
expr jcs:syslog(25, $new_message);
}
/* close the connection. End of the script */
expr jcs:close( $connection );
}
}
}
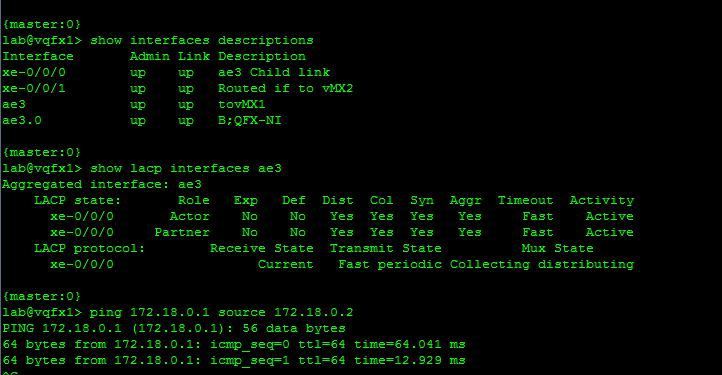
When commit is passed this kind of syslog is generated:
Apr 15 15:35:13 MXbob cscript: Event-script LACP-DAMP: LACP on xe-0/0/0 flapped too many times. Disable it by config
2/ Auto-disable when CRC errors
Framing errors (aka. CRC errors) degrade the quality of the services, and we usually want to remove traffic on links that experience these kind of errors. OAM LFM provides a way to automatically trigger Link_DOWN event when a given amount of framing or symbol errors is detected on a link. But, currently on Junos we can trigger action only when a link experiences a rate of 10-1 framing error. This if often too late. What I want is to automatically shutdown a link when we reach a rate of 10-5 or 10-6 framing errors.
To build this feature I used 2Junos features: event-policy and a rmon probe. RMON is a Remote Monitoring feature which was described in RFC 2021, 2613 and 2819. This feature is actually an internal SNMP agent which can poll the internal MIB objects (SNMP get) or Tables (SNMP walk) and trigger syslog and/or trap when a given value of the MIB reaches a configurable threshold between 2 pollings.
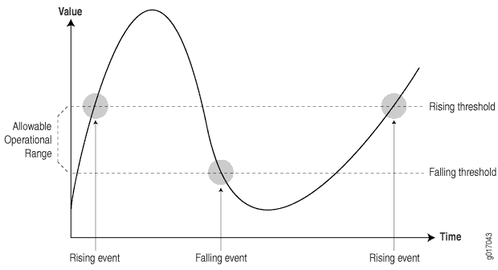
The probe raised an event when a "rising threshold" is reached and can generate a second event when a "falling threshold" is reached. The following graph explains the concept:
The RMON probe is configured like this. I use the walk request type to automatically create an instance for each object of the table IfJnxInFrameErrors (CRC error for each physical interface) .
snmp {
rmon {
alarm 1 {
description "CRC monitoring";
interval 30;
variable ifJnxInFrameErrors;
sample-type delta-value;
request-type walk-request;
rising-threshold 360;
falling-threshold 0;
rising-event-index 1;
falling-event-index 2;
syslog-subtag CRC_WARN;
}
event 1 {
description "Generate Event - Too many CRC";
type log;
}
event 2 {
description "Generate Event - No more CRC";
type log;
}
}
}
Every 30s the SNMP agent polls the FrameError mib and computes for each IFindex the delta framing errors since the last 30 secs. If this value is upper than 360 (rising threshold) it triggers a specific syslog:
Apr 15 16:52:29 MXbob snmpd[62774]: SNMPD_RMON_EVENTLOG: CRC_WARN: Event 1 triggered by Alarm 1, rising threshold (360) crossed, (variable: ifJnxInFrameErrors.820, value: 7395)
Then if for a given IFindex the delta framing errors falls to zero the second syslog is generated:
Apr 15 16:53:44 MXbob snmpd[62774]: SNMPD_RMON_EVENTLOG: CRC_WARN: Event 2 triggered by Alarm 1, falling threshold (0) crossed, (variable: ifJnxInFrameErrors.820, value: 0)
Here I set a rising threshold to 360 frames. I computed this value like that: for a 10Ge interface if I have a half oaded link (5Gbits/s) and an average packet size of 512Bytes, I should receive around 36M of packets in 30 seconds (window time configured). If I want to shutdown the link when the link experiences 10-6 corrupted frames; the number of CRC errors in 30 seconds should be around 360.
Now, I've generated my events (syslog), so I can again use an event-policy which will track the "rising event" and then call a dedicated event script that will perform actions.
The event policy is the following:
event-options {
policy RMON-CRC {
events snmpd_rmon_eventlog;
then {
event-script rmon-crc.slax;
}
}
event-script {
file rmon-crc.slax;
}
}
Again, the script rmon-crc.slax must be pushed on both RE in the folder /var/db/scripts/event before committing the above event-policy.
The rmon-crc.slax script is available here. And detailed below:
/* ------------------------------------------------*/
/* Slax written by door7302@gmail.com Version 1.0 */
/* ------------------------------------------------*/
version 1.0;
ns junos = "http://xml.juniper.net/junos/*/junos";
ns xnm = "http://xml.juniper.net/xnm/1.1/xnm";
ns jcs = "http://xml.juniper.net/junos/commit-scripts/1.0";
import "../import/junos.xsl";
match / {
/* Init some variables used to parse the syslog message */
var $regex1="rising";
var $regex2="falling";
var $sep1 = "(,)";
var $sep2 = "\\.";
/* Retrieve the entire syslog */
var $message = event-script-input/trigger-event/attribute-list/attribute[name=="message"]/value;
/* Find1 is a rising syslog and Find2 the falling syslog */
var $find1 = jcs:regex($regex1,$message);
var $find2 = jcs:regex($regex2,$message);
/* IF I received a RMON rising syslog */
if ($find1 !="") {
/* Retrieve the ifindex value from the syslog */
var $mytab1 = jcs:split ($sep1,$message);
var $mytab2 = jcs:split ($sep2,$mytab1[3]);
var $ifindex = $mytab2[2];
/* Seek the interface name based on the ifindex */
var $myrpc1 = <get-interface-information> {
<snmp-index> $ifindex;
}
var $iif-info = jcs:invoke ($myrpc1);
var $iif = $iif-info/physical-interface/name;
/* Init the config. environment */
var $configuration-rpc = {
<get-configuration database="committed" inherit="inherit">;
<configuration> {
<interfaces>;
}
}
/* Open the config. connection */
var $connection = jcs:open();
var $configuration = jcs:execute( $connection, $configuration-rpc );
/* create the config change template */
var $change = {
<configuration> {
<interfaces> {
<interface> {
<name> $iif;
<disable>;
}
}
}
}
/* Try to commit the change and retrieve the result */
var $results := { call jcs:load-configuration( $connection, $configuration=$change ); }
/* If there is an error: generate a specific syslog */
if( $results//xnm:error ) {
for-each( $results//xnm:error ) {
expr jcs:syslog(25, "NEW event-script RMON-CRC: Error, failed to commit..." );
}
}
/* If commit passed, generate a human readable syslog */
else {
var $new_message = "Event-script RMON-CRC: Too many CRC errors on " _ $iif _ " Disable it by config";
expr jcs:syslog(25, $new_message);
}
/* close the connection */
expr jcs:close( $connection );
}
/* If RMON falling syslog is received */
/* Just generate a human readable syslog */
if ($find2 !="") {
var $mytab1 = jcs:split ($sep1,$message);
var $mytab2 = jcs:split ($sep2,$mytab1[3]);
var $ifindex = $mytab2[2];
var $myrpc1 = <get-interface-information> {
<snmp-index> $ifindex;
}
var $iif-info = jcs:invoke ($myrpc1);
var $iif = $iif-info/physical-interface/name;
var $new_message = "Event-script RMON-CRC: No more CRC error on " _ $iif;
expr jcs:syslog(25, $new_message);
}
}
When commit is passed this kind of syslog is generated:
Apr 16 10:02:24 MXbob cscript: Event-script RMON-CRC: Too many CRC errors on xe-1/3/3 Disable it by config
David.